The contractile function of the RV is difficult to measure in clinical practice due to its complex anatomy. Historically, little attention has been paid to this particular chamber, because its roll was wrongly assumed to be passive. Only in the last three decades it has been shown that the function of the RV plays an important role in the survival of many cardiac conditions. Therefore, echocardiographic evaluation of the right ventricular anatomy and function has increasingly gained interest.
RV size
| Linear | |||
| RV basal diameter (mm) | 33 ± 4 | 25 – 41 | |
| RV mid diameter (mm) | 27 ± 4 | 19 – 35 | |
| RV longitudinal diameter (mm) | 71 ± 6 | 59 – 83 | |
| RVOT PLAX diameter (mm) | 25 ± 2.5 | 20 – 30 | |
| RVOT proximal diameter (mm) | 28 ± 3.5 | 21 – 35 | |
| RVOT distal diameter (mm) | 22 ± 2.5 | 17 – 27 | |
| RV Wall thickeness | 3 ± 1 | 1 – 5 | |
| Area by gender | |||
| RVOT EDA (cm²) MALE | 17 ± 3.5 | 10 – 24 | |
| RVOT EDA (cm²) FEMALE | 14 ± 3 | 8 – 20 | |
| RV EDA BSA (cm/m²) MALE | 8.8 ± 1.9 | 5 – 12.6 | |
| RV EDA BSA (cm/m²) FEMALE | 8.0 ± 1.75 | 4.5 – 11.5 | |
| RV ESA (cm/m²) MALE | 9 ± 3 | 3 – 15 | |
| RV ESA (cm/m²) FEMALE | 7 ± 2 | 3 – 11 | |
| RV ESA BSA (cm/m²) MALE | 4.7 ± 1.35 | 2.0 – 7.4 | |
| RV ESA BSA (cm/m²) FEMALE | 4.0 ± 1.2 | 1.6 – 6.4 | |
| Volume by gender | |||
| RV EDV BSA (mL /m²) MALE | 61 ± 13 | 35 – 87 | |
| RV EDV BSA (mL /m²) FEMALE | 53 ± 10.5 | 32 – 74 | |
| RV ESV BSA (mL /m²) MALE | 27 ± 8.5 | 10 – 44 | |
| RV ESV BSA (mL/m²) FEMALE | 22 ± 7 | 8 – 36 | |
| Parameter | Mean ± SD | Normal range | |
|---|---|---|---|
EDA, end-diastolic area ; ESA, end-systolic area; EDA, end-diastolic volume ; ESA, end-systolic volume
RV function
| Parameter | Abnormality threshold |
|---|---|
| TAPSE (mm) | <17 |
| PW Doppler S wave (cm/s) | <9.5 |
| Color Doppler S wave (cm/s) | <6.0 |
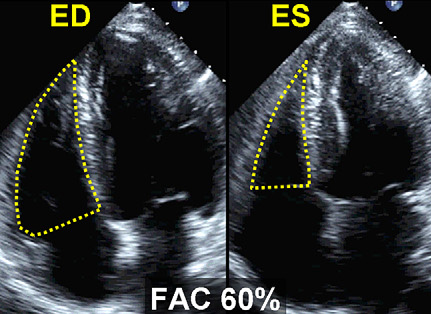
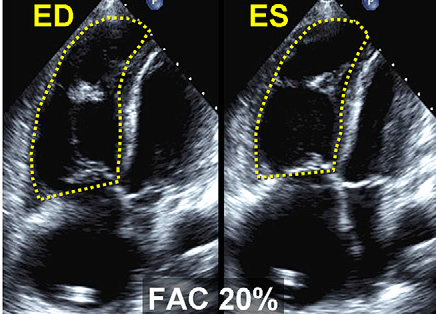
| RV FAC (%) | <35 |
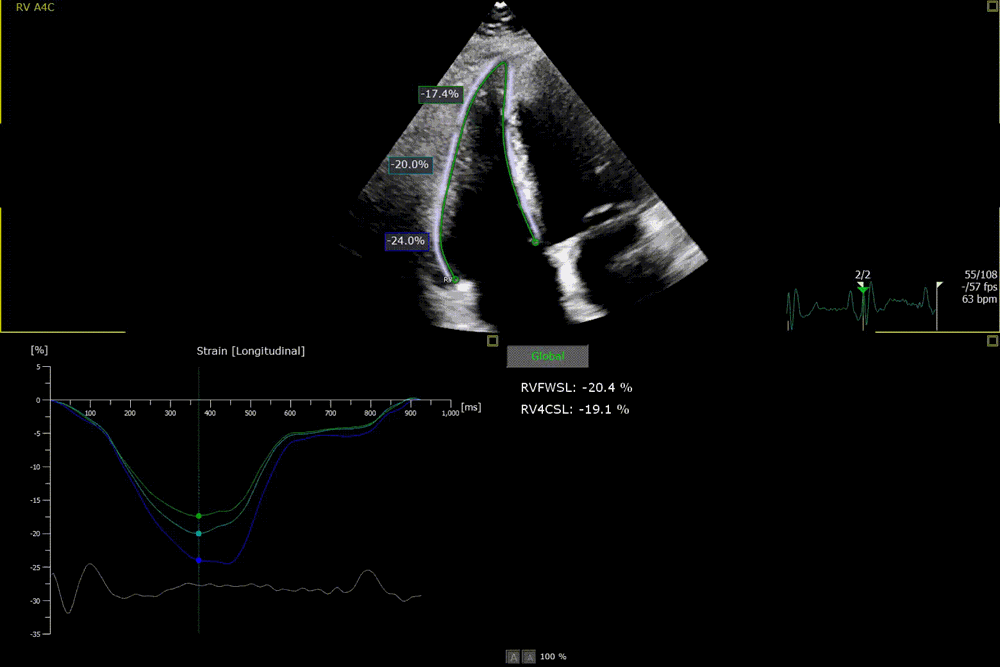
| RV Freewall strain* (%) | > -20 |
| RV 3D EF (%) | <45 |
| PW Doppler MPI | >0.43 |
| Tissue Doppler MPI | >0.54 |
| DecT (ms) | <119 or >242 |
| E/A | <0.8 or >2.0 |
| é/á | <0.52 |
| é (cm/s) | <7.8 |
| E/é | >6.0 |
RV strain
| Variable | LRV | Mean (95% CI) | URV |
|---|---|---|---|
| 2D peak strain rate at the base (s) | 0.70 (0.50-0.90) | 1.62 (1.50-1.74) | 2.54 (2.34-2.74) |
| 2D peak strain rate at the mid cavity (s) | 0.85 (0.66-1.04) | 1.54 (1.46-1.62) | 2.23 (2.04-2.42) |
| 2D peak strain rate at the apex (s) | 0.86 (0.46-1.25) | 1.62 (1.46-1.79) | 2.39 (1.99-2.78) |
| 2D peak strain at base (%) | 18 (14-22) | 28 (25-32) | 39 (35-43) |
| 2D peak strain at mid cavity (%) | 20 (15-24) | 29 (25-33) | 38 (34-43) |
| 2D peak strain at the apex (%) | 19 (15-22) | 29 (26-32) | 39 (36-43) |
| Doppler peak strain rate at the base (s) | 1.00 (0.63-1.38) | 1.83 (1.50-2.15) | 2.66 (2.28-3.03) |
| Doppler peak strain rate at mid cavity (s) | 0.98 (0.68-1.28) | 1.88 (1.73-2.03) | 2.79 (2.49-3.09) |
| Doppler peak strain rate apex (s) | 1.14 (0.60-1.69) | 2.04 (1.57-2.51) | 2.93 (2.39-3.48) |
| Doppler peak strain at the base (%) | 13 (09-17) | 29 (27-31) | 45 (41-49) |
| Doppler peak strain mid cavity (%) | 13 (9-18) | 31 (29-32) | 48 (44-52) |
| Doppler peak strain apex (%) | 17 (12-21) | 30 (27-34) | 44 (39-48) |
CI, Confidence interval; LRV, lower reference value; URV, upper reference value .
Reference limits cannot be recommended, because of very wide confidence intervals both around the mean values and around the reference limits. Strain and strain rate remain research tools in experienced labs until their limitations can be overcome.
The information above comes from Echocardiografie.nl. Last changed on: 5 September 2023.