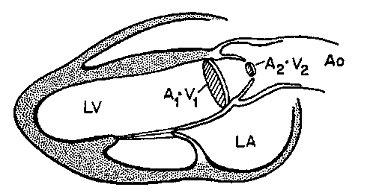
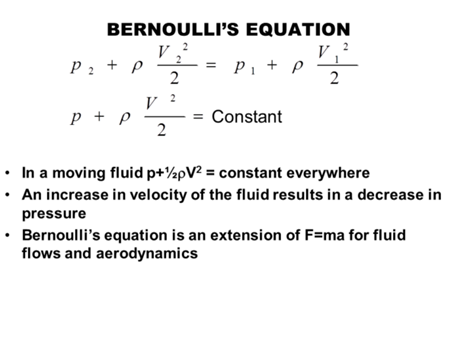
Proximal isovelocity surface area
Stroke Volume and Cardiac Output
Bernoulli’s principle
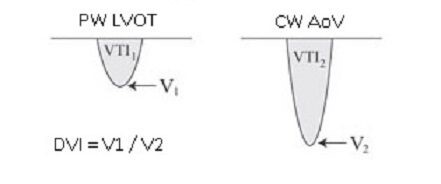
Simplified formula for converting velocity difference obtained by spectral Doppler to instantaneous pressure gradient. This clinical equation has been derived from the more complex Bernoulli equation by assuming that viscous losses and acceleration effects are negligible and by using an approximation for the constant that relates to the mass density of blood, a conversion factor for measurement units. In addition, the simplified Bernoulli equation assumes that the proximal velocity can be ignored, a reasonable assumption when velocity is <1 m/s because squaring a number <1 makes it even smaller. When the proximal velocity (V1) is over >1.5 m/s or the aortic velocity (V2) is >3.0 m/s, the proximal velocity should be included in the Bernoulli equation.
Calculation
ΔP = P2 − P1 = 4 • (V2² − V1²)
J Am Soc Echocardiogr. 2009 Jan;22(1):1-23
Continuity equation
Aortic valve area (AVA) can be calculated by using the principle of conservation of mass: “What comes in, must go out”. Aortic valve area indexed to body surface area should be considered for the large and small extremes of body surface area. For patients with prosthetic aortic valves, patient-prosthesis mismatch (PPM) is suspected when effective orifice area (EOA) indexed to body surface area <0.85 to 0.9 cm²/m². PPM is considered severe when EOA index <0.65.
Calculation |
---|
AVA = (D LVOT / 2)² • π • Vmax LVOT / Vmax |
J Am Soc Echocardiogr. 2009 Jan;22(1):1-23
Myocard performance index
Myocard Performance INdex (MPI) is also known as the Tei-index. MPI incorporates both systolic and diastolic time intervals in expressing global systolic and diastolic ventricular function. Systolic dysfunction prolongs prejection (isovolumic contraction time, IVCT) and a shortening of the ejection time (ET). Both systolic and diastolic dysfunction result in abnormality in myocardial relaxation which prolongs the relaxation period (isovolumic relaxation time, IVRT).
Calculation | Normal value |
---|---|
LIMP=IVCT+IVRT/AVET | < 0.40 |
RIMP=IVCT+ IVRT/PVET | < 0.43 |
J Cardiol. 1995 Dec;26(6):357-66.
Proximal isovelocity surface area
Quantification of mitral regurgitation using the principle of conservation of mass by analyzing the Proximal Isovelocity hemispheric Surface Area (PISA) of the flow convergence on the ventricular side. This method is more accurate for central regurgitant jets than eccentric jets, and for a circular orifice than a non-circular orifice.
Calculation | Normal value |
---|---|
Volume Flow Rate (mL/s) = 2 • π • r² • V(aliasing) | |
ERO=Volume Flow Rate / Vmax Mitral regurgitation | < 20 mm² |
Regurgitant Volume=ERO • VTI mitral regurgitation | <30 mL/beat |
J Am Soc Echocardiogr. 2001 Mar;14(3):180-5.
Stroke Volume and Cardiac Output
The Doppler VTI method in estimating stroke volume and cardiac output correlates well with results of concurrent thermodilution cardiac output determinations in patients without significant left-sided valvular regurgitation.
Calculation | Normal value |
---|---|
SV=π • r² • VTI LVOT | 60-120 mL |
CO=SV • HR/1000 | 4-8 L/min |
Circulation. 1983 Mar;67(3):593-602.
Systemic and pulmonary blood flow (Qp/Qs)
Qp/Qs can be estimated by using 2-D echo and spectral Doppler measurements in patients who have intra- or extra-cardiac shunts e.g. atrial or ventricular septal defects.
Calculation | Normal value |
---|---|
Qp = RVOT VTI • π • (RVOT/2)² | 1:1 |
Qs = LVOT VTI • π • (LVOT/2)² |
Am J Cardiol. 1983 Mar 15;51(6):952-6.
Dimensionless velocity index
It is a ratio of the subvalvular velocity obtained by pulsed-wave Doppler and the maximum velocity obtained by continuous-wave Doppler across the aortic valve. This dimensionless velocity ratio expresses the size of the valvular effective area as a proportion of the CSA of the LVOT. Substitution of the time-velocity integral can also be used as there was a high correlation between the ratio using time-velocity integral and the ratio using peak velocities. In the absence of valve stenosis, the velocity ratio approaches 1, with smaller numbers indicating more severe stenosis. Severe stenosis is present when the velocity ratio is 0.25 or less, corresponding to a valve area 25% of normal.
Calculation | Normal value |
---|---|
DVI=max LVOT/PGmax AoV | >0.50 |
J Am Soc Echocardiogr. 2009 Jan;22(1):1-23
Flow patterns
Examples of normal and deviant flow patterns.