Left ventricle

LV dimensions

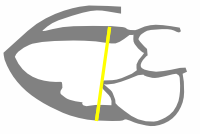
Each echocardiogram include an assessment of LV dimensions, describing wall thickness and function. Good measurements are essential and may have implications for therapy. LV dimensions must be measured in PLAX, end-diastolic and end-systolic and valves (MV and AOV) are closed. The measurement is situated in the basal part of the LV by the chordae.

LVEDd


LV size

Reference limits and partition values of left ventricular size
  MEN WOMEN
  Reference Mildly Moderately Severely Reference Mildly Moderately Severely
  Range Abnormal Abnormal Abnormal Range Abnormal Abnormal Abnormal
LV dimension    
LV diastolic diameter, cm 4.2–5.8 5.9–6.3 6.4–6.8 ≥6.9 3.8–5.2 5.3–5.6 5.7–6.1 ≥6.2
LV diastolic diameter/BSA, cm/m2 2.2–3.0 3.1–3.3 3.4–3.6 ≥3.7 2.3–3.1 3.2–3.4 3.5–3.7 ≥3.8
LV systolic diameter 2.5–4.0 4.1–4.3 4.4–4.5 ≥4.6 2.2–3.5 3.6–3.8 3.9–4.1 ≥4.2
LV systolic diameter/BSA, cm/m2 1.3–2.1 2.2–2.3 2.4–2.5 ≥2.6 1.3–2.1 2.2–2.3 2.4–2.6 ≥2.7
LV volume
LV diastolic volume, mL 62–150 151–174 175–200 ≥201 46–106 107–120 121–130 ≥131
LV diastolic volume/BSA, mL/m2 34–74 75–89 90–100 ≥101 29–61 62–70 71–80 ≥81
LV systolic volume, mL 21–61 62–73 74–85 ≥86 14–42 43–55 56–67 ≥68
LV systolic volume/BSA, mL/m2 11–31 32–38 39–45 ≥46 8–24 25–32 33–40 ≥41


LV systolic function

Each echocardiogram include an assessment of LV dimensions, describing wall thickness and function. It is essential to make multiple measurements for a proper assessment of LV function.

LV function

Reference limits and values and partition values of left ventricular function
  MEN WOMEN
  Reference Mildly Moderately Severely Reference Mildly Moderately Severely
  range abnormal abnormal abnormal range abnormal abnormal abnormal
Wallmotion score index 1.0 1.0-1.5 1.5-2.0 <2.0 1.0 1.0-1.5 1.5-2.0 <2.0
Endocardial fractional shortening (%) 25-43 20-24 15-19 ≤14 27-45 22-26 17-21 ≤16
Midwall fractional shortening (%) 14-22 12-13 10-11 ≤10 15-23 13-14 11-12 ≤10
Myocard performance index <0.40       <0.40      
dP/dt (mmHg/s) >1100     <500 >1100     <500
Ejection fraction (%) 52 - 72 41 - 51 30 - 40 <30 54 - 74 41 - 53 30 - 40 <30

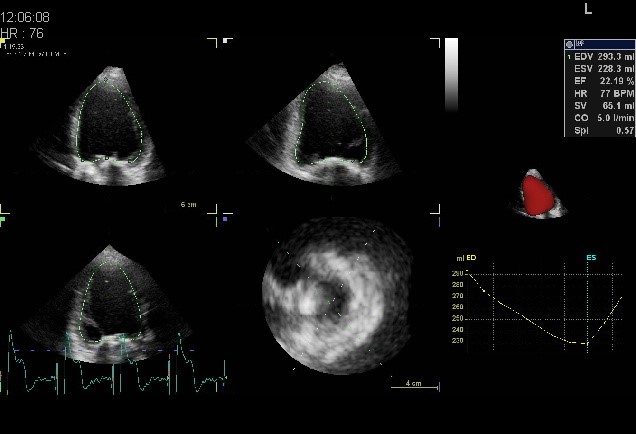
Eyeballing LVEF
Cardiac ejection fraction (EF) eyeballing may be the most accurate echocardiographic method for the assessment of left ventricular systolic function. Test yourself and learn by doing with this QUIZ.

LVEF3D02

LV Strain

Parameter All Levels Apical Mid Basal pValue (Levels)
All Walls -18.6±5.1 -20.2±5.6 -18.7±3.3 -17.0±5.2 <0.0001
Anterior -19.5±4.2 -19.4±5.4 -18.8±3.4 -20.1±4.0 0.001
Anteroseptal -18.8±4.2 -18.8±5.9 -19.4±3.2 -18.3±3.5 0.001
Inferior -20.0±4.5* -22.5±4.5 -20.4±3.5 -17.1±3.9 <0.0001
Lateral -18.3±4.7 -19.2±5.4 -18.1±3.5 -17.3±5.0 0.06
Posterior -16.3±6.3 -17.7±6.0 -16.8±5.0 -14.5±7.4 <0.0001
Septal -18.3±5.3 -22.3±4.8 -18.7±3.0 -13.7±4.0 <0.0001
p (walls) <0.0001 <0.0001 <0.0001 <0.0001  

*inferior was significantly different from other walls (p<0.001 except anterior p+0.002), in the comparison of walls at all levels.Posterior was significantly different from all other walls (p<0.0001). In the comparison oflevels in all walls, each level was significantly different (p <0.0001). LV=left ventricular, TQ=tracking quality.
LV diastolic function

Still a lot remains unclear about the pathophysiology of diastolic heart failure, which still lacks an effective treatment, with a high mortality rate associated with diastolic heart failure over the last decades. Diastolic heart failure is characterized by an increased LV diastolic stiffness. There are some important echocardiographic measurements that should be included in the standard ultrasound examination in order to a properly assessment of the LV stiffness.

Echocardiographic reference ranges for normal cardiac Doppler data: results from the NORRE Study
Parameters 20–40 years 40–60 years >60 years P
  Mean±SD 95% CI Mean±SD 95% CI Mean±SD 95% CI  
E-wave velocity (m/s) 0.82 ± 0.16 0.53–1.22 0.75 ± 0.17 0.46–1.13 0.70 ± 0.16 0.39–1.03 <0.001
A-wave velocity (m/s) 0.50 ± 0.13 0.30–0.87 0.62 ± 0.15 0.37–0.97 0.77 ± 0.16 0.40–1.04 <0.001
E-wave deceleration time (ms) 178 ± 43 105–269 187 ± 45 114–288 208 ± 62 114–385 <0.001
E/A ratio 1.71 ± 0.52 0.89–3.18 1.24 ± 0.39 0.71–2.27 0.98 ± 0.29 0.53–1.80 <0.001
Septal e' wave (cm/s) 12.1 ± 2.5 8.0–17.0 9.8 ± 2.6 5.0–16.0 7.6 ± 2.3 3.0–13.0 <0.001
Septal a' wave (cm/s) 8.5 ± 1.7 5.3–12.0 9.8 ± 2.0 6.9–14.0 10.5 ± 1.7 7.0–14.0 <0.001
Lateral e' wave (cm/s) 16.4 ± 3.4 10.0–23.0 12.5 ± 3.0 6.0–18.0 9.6 ± 2.8 4.0–17.0 <0.001
Lateral a' wave (cm/s) 8.2 ± 2.2 5.0–13.0 9.4 ± 2.6 5.0–15.0 10.6 ± 2.9 6.0–17.0 <0.001
Average septal and lateral e' wave (cm/s) 14.3 ± 2.7 9.1–19.5 11.1 ± 2.5 6.0–16.0 8.6 ± 2.3 3.5–15.0 <0.001
Septal E/e' 6.9 ± 1.6 4.4–10.6 8.1 ± 2.3 4.3–13.2 9.7 ± 2.8 5.0–16.9 <0.001
Lateral E/e' 5.1 ± 1.3 3.1–8.5 6.3 ± 2.2 3.7–12.0 7.8 ± 2.2 4.2–12.8 <0.001
Average septal and lateral E/e' 5.8 ± 1.3 3.6–9.1 7.0 ± 2.1 4.2–11.5 8.5 ± 2.2 4.6–13.5 <0.001
Average E/e' 5.6 ± 1.1 3.7–7.9 6.8 ± 1.8 4.0–11.6 8.3 ± 2.2 4.4–14.8 <0.001

P differences between groups according to age category (one-way ANOVA).

Most important cut-off values for diastolic parameters

Parameter Cut-off value
TR Vmax > 2.8m/s
é septal < 7 cm/s
é lateral < 10cm/s
E/é >14
LAVi > 34ml/m²
LA Reservoir Strain < 18%

The information above comes from Echocardiografie.nl. Last changed on: 4 September 2023.